


Defense is Big Business
But where is the money going?
Defense has always been big business.
But, not like this.
In this edition, we’re going to explore what the market opportunity is for defense-focused and dual-use startups, what sorts of investments the Department of Defense is making, and who is capturing that money.
But if a company is looking to support Defense, then no matter how much private capital they raise, at some point they need to have recurring revenues.
Dual-use technology companies can commercialize their products and sell to normal markets, but defense-focused companies need to sell to the government.
Fortunately for them and for our Defense sector in general, Congress has seen fit to provide the Department of Defense with a healthy budget that allows purchasing goods and services from these companies.
Budgets, Budget Areas, and Subcategories
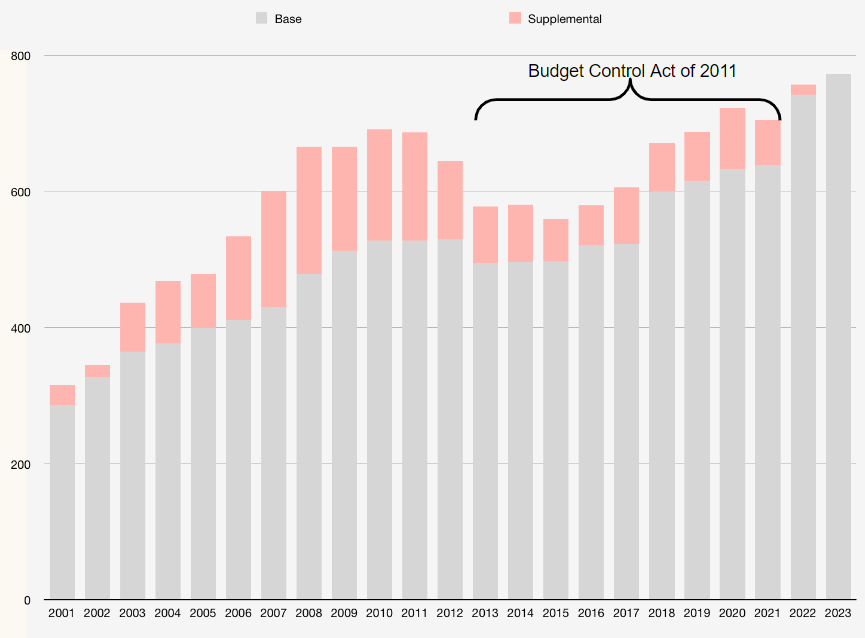
The President requested $773 billion for 2023. Congress met that request and more, appropriating $797.7 billion in discretionary spending. This is up by more than $69 billion from 2022.
In fact, the Defense budget has grown 145% since 2001 (this is due in part to the Budget Control Act of 2011) and 38% 2015.
Even as congressional republicans have started calling to reduce the department’s budget, it is not outside the realm of the possible that we will see the first $1 trillion defense budget in the next decade.
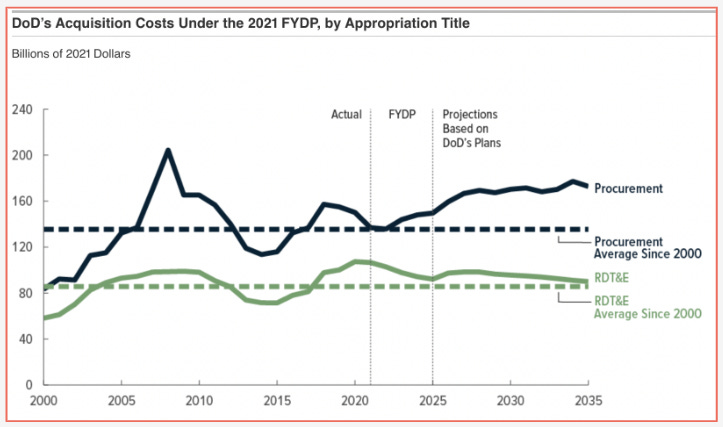
The bulk of this budget goes to routine expenditures including manpower costs, operations & maintenance, and housing. However, more than $275 billion (about 1/3rd of the budget) is set aside for the categories of “research, development, testing, & evaluation,” and “procurement” or R-1 and P-1, as they are respectively known within the Pentagon.
I won’t wade too deeply into the arguments of how the Department should split allocation of money between RDT&E and Procurement, here. Pete Modigliani and Matt MacGregor have highlighted, there has been a shift from 1:3 (R:P) to nearly 4:5 (R:P). Others have shown that there’s greater fluctuations and point to the the period in the late 2000s when the procurement budget area was more than twice as large as the RDT&E budget area. Further, the increased RDT&E maybe temporary as we rebuild our forces and reorient towards large scale combat operations. Maybe I’ll share more thoughts on this topic in the future.
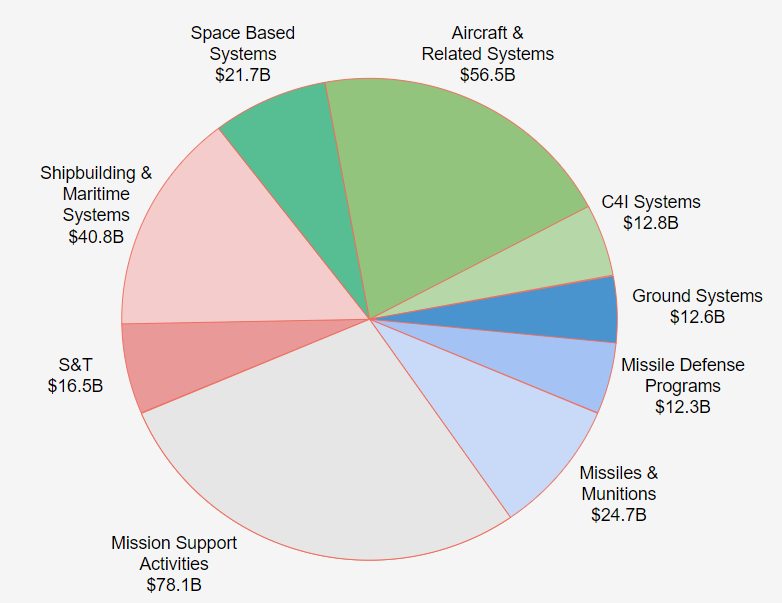
Having said that, I am lumping these two buckets of spending together for this article. There is significant overlap between them and they share subcategories which include:
Aircraft & Related System ($56.5 billion)
C4I Systems ($12.8 billion)
Ground Systems ($12.6 billion)
Missile Defense Programs ($12.3 billion)
Missiles & Munitions ($24.7 billion)
Mission Support Activities ($78.1 billion)
S&T ($16.5 billion)
Shipbuilding & Maritime Systems ($40.8 billion)
Space Based Systems ($21.7 billion)
All of this is to say that the Defense Department represents a customer with very deep pockets. Defense is a massive market opportunity if a company can break into it.
Defense Unicorns and Soonicorns vs. the Primes
Much is made about the end of Cold War 1 and the “Last Supper,” a meeting where then Secretary of Defense William Perry encouraged various defense industry companies to consolidate. As Eric Lofgren has pointed out, the reality is that defense industrial base consolidation began before the Last Supper, but it certainly accelerated as part of the peace dividends in the 1990s.
The result has been market domination of defense by a few companies, colloquially known as the Defense Primes.
So, just how dominant are the Primes?
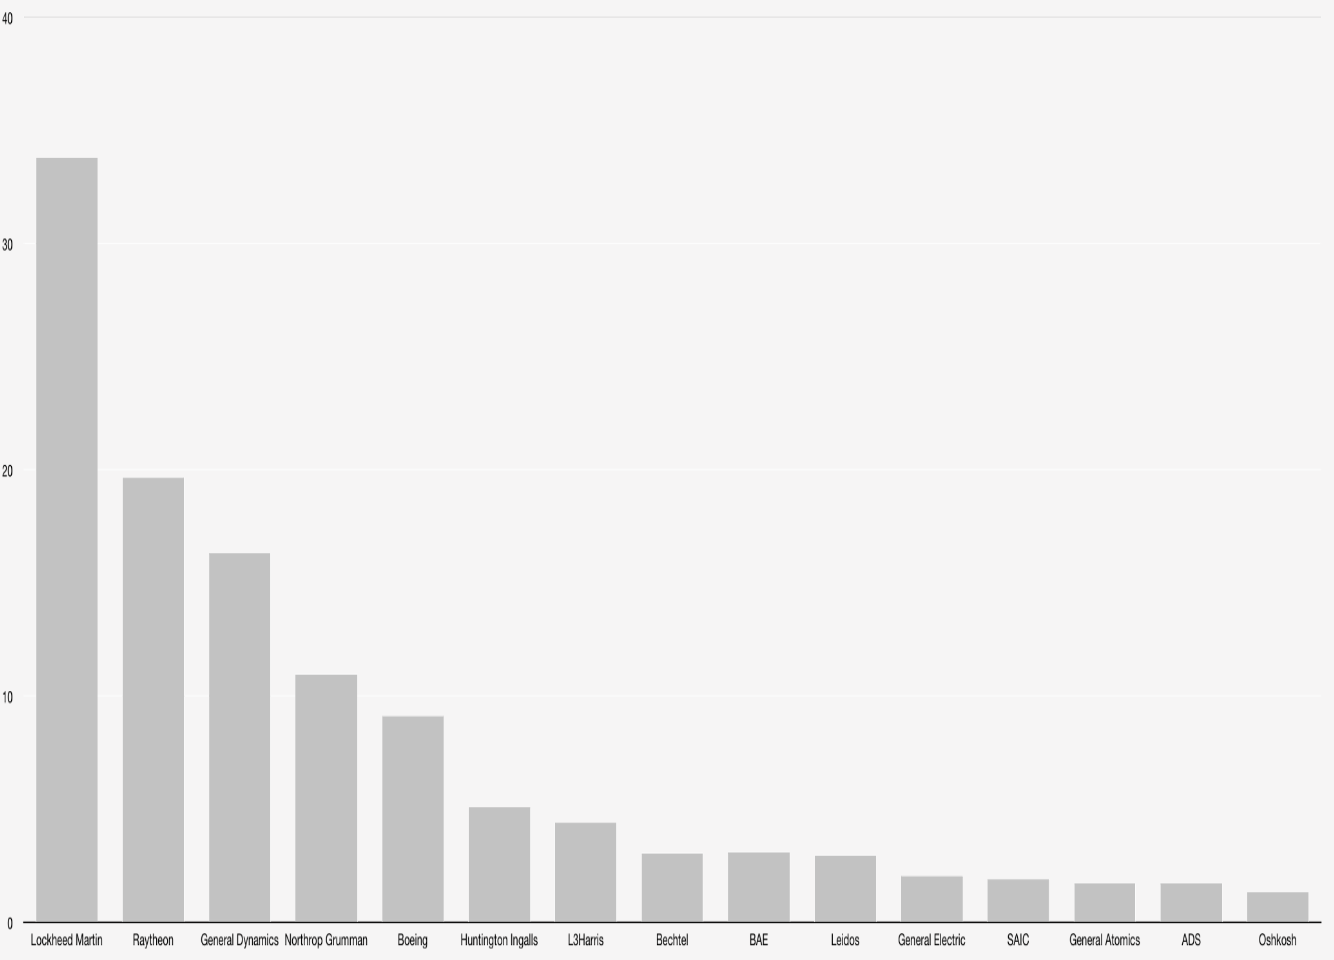
Looking at a graph of the value of contracts paid to the largest primes in a single fiscal year shows that the power law is at play and there is certainly a long tail distribution. Lockheed Martin took home nearly $35 billion in defense spending over the year, #2 Raytheon took home nearly $20 billion.
This market domination is ripe for massive disruption.
In the past few years, there’s been a lot of excitement about the “SHARPE” set of defense-focused companies. These are startups (and one public company) that have been particularly successful in the defense sector and include:
Shield AI
Hawkeye 360
Anduril
Rebellion Defense
Palantir
Epirus
These companies represent the set of Defense Unicorns, or private companies valued at more than $1 billion. The exception here is Palantir, which went public via an initial public offering (IPO) in 2020. Palantir currently enjoys a market cap of $17.6 billion. Since their IPO, another company has entered as a Defense “Soonicorn” meaning that it is highly likely that they will reach unicorn status in the near future. That company is Vannevar Labs.
So how do these unicorns and soonicorns stack up compared to the Primes?
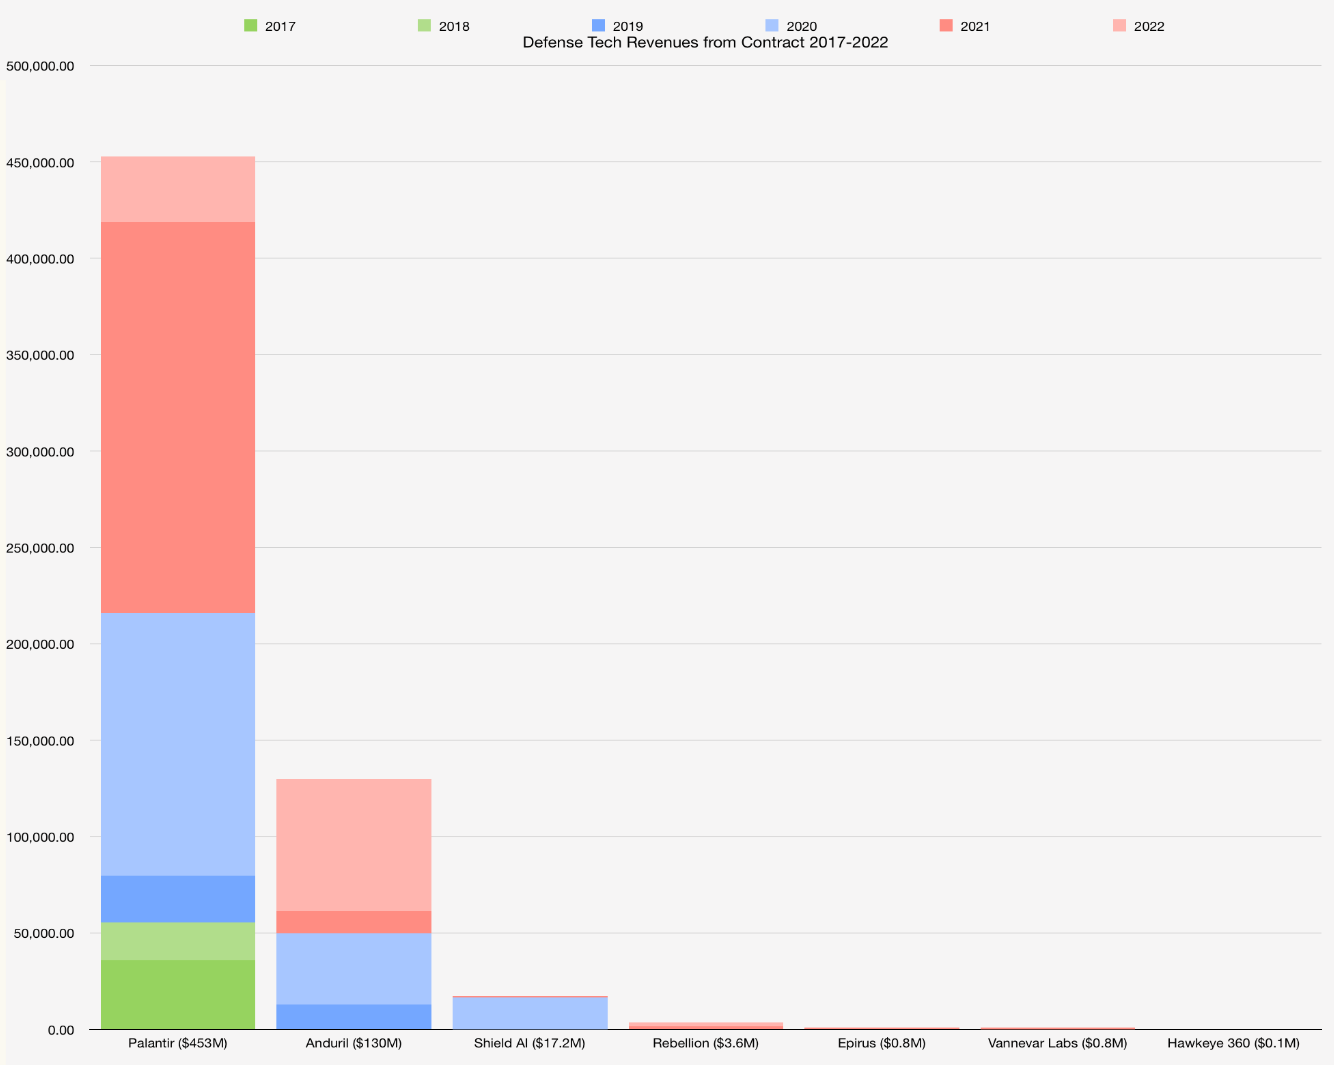
First, I want to acknowledge that much of the revenues that these companies have enjoyed are not captured in the above graph. Many contracts are classified, and as such are not accurately captured in USASpending. Nevertheless, the contrast remains stark between what the government is paying the primes and what the Unicorns / Soonicorns have been able to capture to date—in a longer time period.
It might be tempting to look at these graphs and question why anyone would want to try to compete with the Primes. I look at the graphs and recognize that we’re just starting to see the disruption that will be forthcoming, completely upsetting the landscape in the next ten years.
Next week, we’ll dig in deeper on why these graphs are not portents of doom for the DefenseTech startup scene and why we should see that this is just the start of a revolution.
Until then…
Keep building!
Andrew